


Lunation or New Moon and Full Moon charts have been used by Mundane Astrologers for many centuries. In later times, people have started comparing them to their natal charts.

You can use the Stations window to watch the path of a planet through it's entire retrograde period.

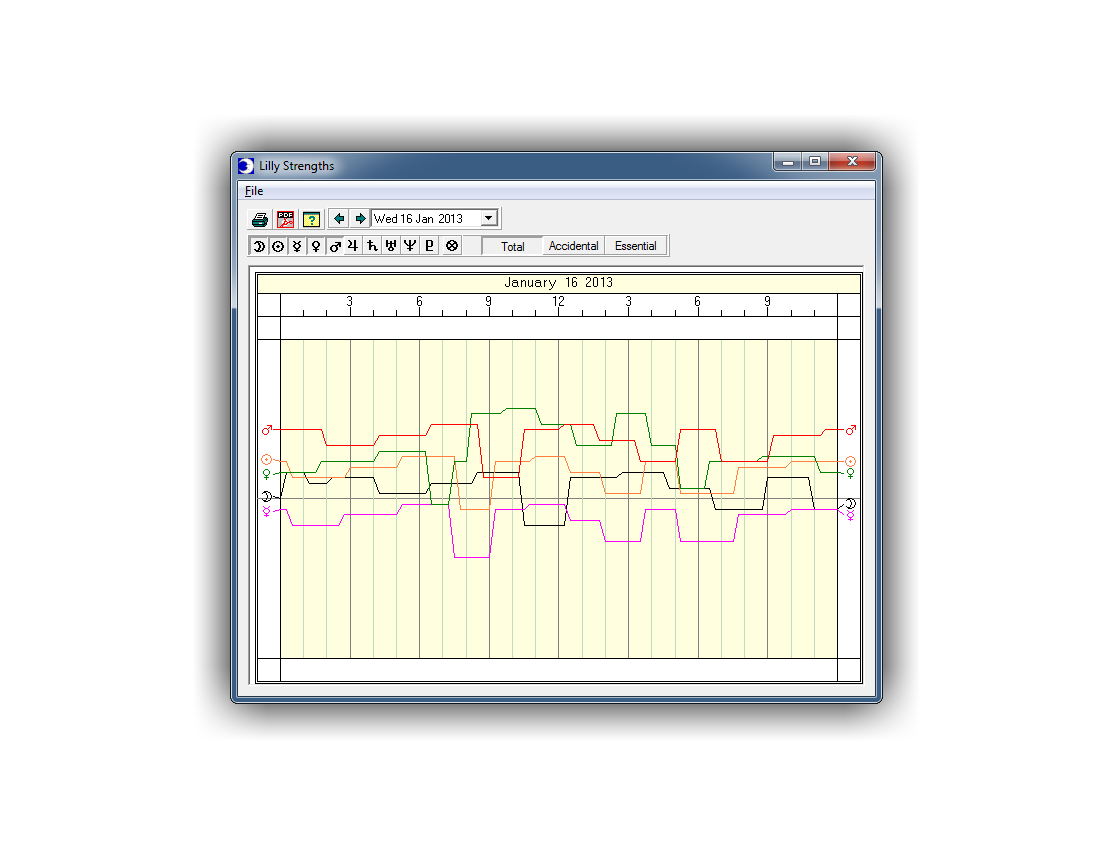
This graph calculates a chart every 15 minutes and plots the values over a 24-hour period. It is possible to watch the values rise and fall as the earth turns and the planets move through the angles and houses.

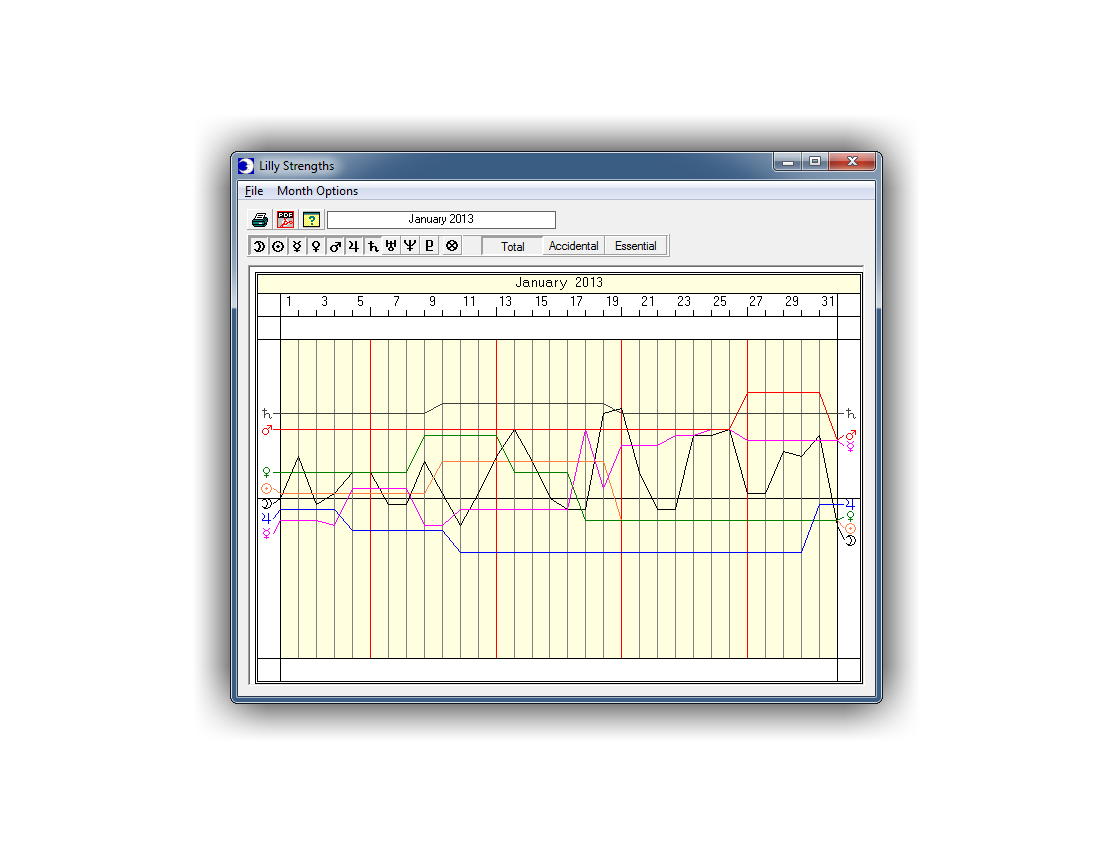
This graph calculates a chart once a day over the period of a month. It lets you distinguish one day from another.


This window will show you the times of the day that each of the ten planets will conjunct either the transiting Ascendant or the transiting Midheaven on a given day.


The Lunar/Planetary Cycle graph shows you when the Moon is going to be Conjunct, Square, or Opposed to either the transiting or natal planets during the month.
- Top Line: Oppositions
- Middle Line: Squares
- Bottom Line: Conjunctions

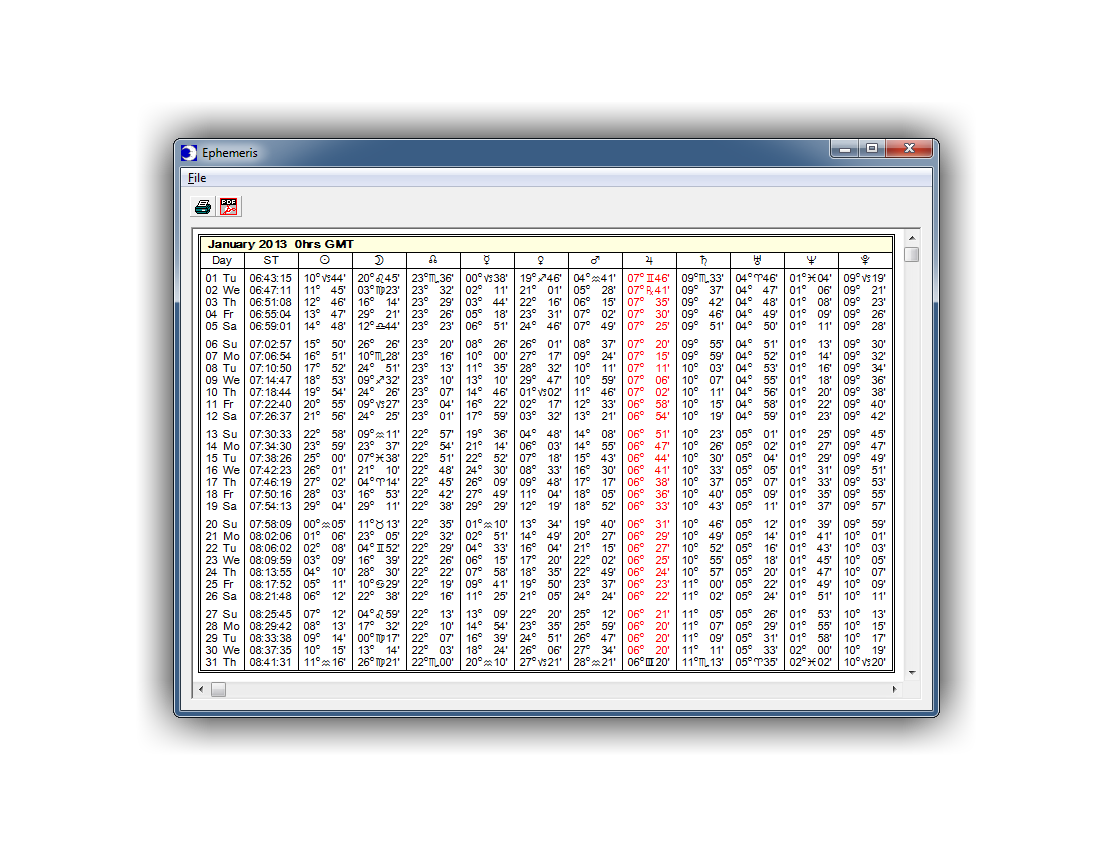
When you bring up the Ephemeris in the program, you will see that there may be planets in red. Planets in red are Retrograde, so you can easily see it and note that they are getting smaller rather than larger.


Planets travel in a 360° circle around the sun, but they do not constantly stay at the same latitude. In fact, they are always moving up or down. These "ups and downs" are measured as the distance between a planet's current position and the earth's equator. This measurement is known as declination.


Simply enter two dates and click the Sub button to find out how many Days, Months, and Years separate the two dates.


Natal Chart of the current birth chart. You can select which wheel style you want to use: House, Unequal House, Euro, and Aries, also you can print the chart or create a PDF file for saving and e-mailing.

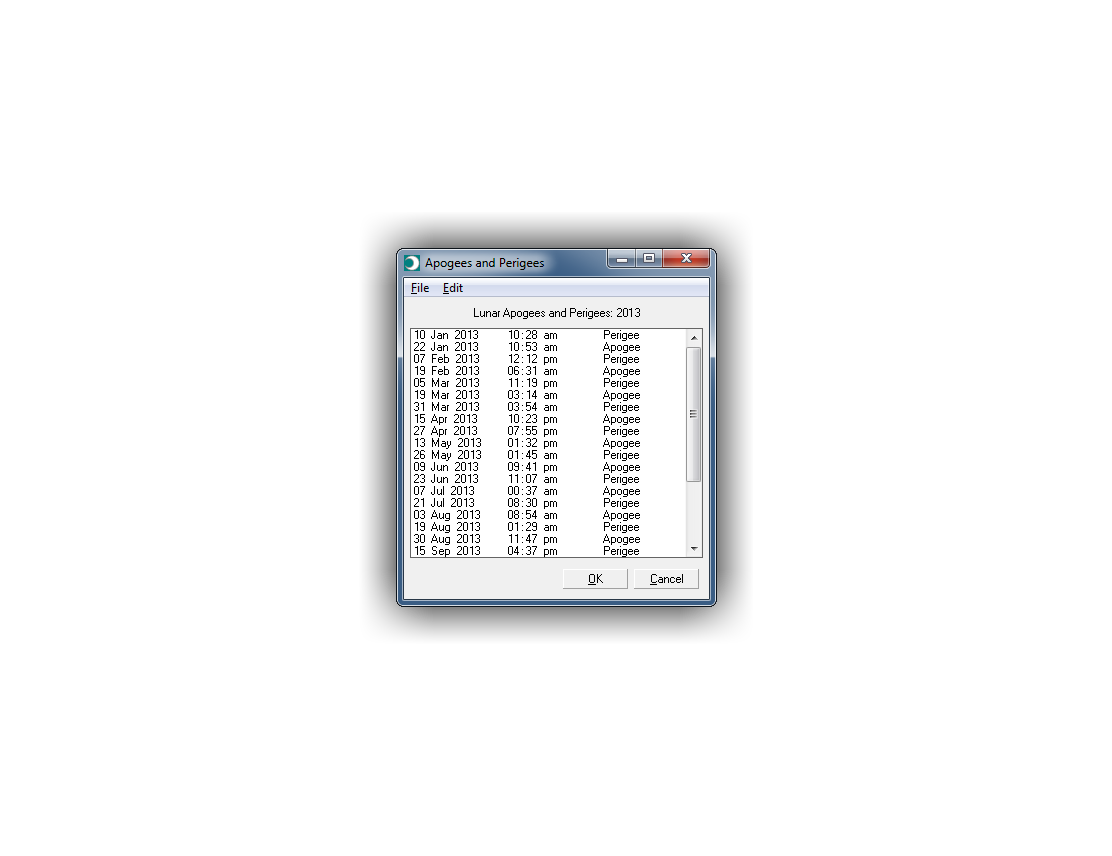
Dates and times for the year's Lunar Apogees and Perigees.


Hindu Lunar Days for the month.
 |
Win*Star 6.0 Pro $359.95 Was $399.95 |
 |
Blue*Star Pro $499.95 Was $999.95 |
 |
Matrix Horizons $179.95 |
| See Our Complete Home Business System here. | |